Requirements Modeling Structured Analysis in Software Engineering
Chapter 4
Introduction
Chapter 3 examined Requirements Analysis and we briefly talked about the importance of modeling as a core activity of analysis. There are various analysis methods, where each methods produces a set of models. In this chapter we will look at Structured Analysis, one of the earlier methods that have been used for many years.
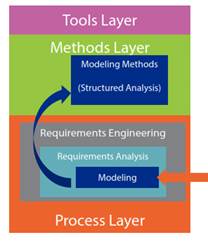
Figure 1 Structured Analysis’s position in SE
Methods for Analysis
The focus of analysis modeling is the “what” not the “how”. Design phase focuses on “how”.
Analysis modeling answers important questions, such as:
- How actors interact with the system?
- What information does the system consume and produce (input/output)?
- What functions does the system perform?
- How does the system behave in response to certain events?
- Under what constraints does the system operate?
Analysis models serve various purposes, such as:
- Show the system at different abstraction levels
- Become the main driver of the Design phase
- Become input to derive Acceptance Tests for the Validation
Always keep in mind two golden rules that should guide your modeling effort: 1) strive to keep the models simple, 2) any useful notation is a good notation. (e.g. if your using OOA&D but you find that DFD{data flow diagram} is useful, you could and should use it!)
There are various method for analysis, two of the most used are Structured Analysis and Object-Oriented Analysis.
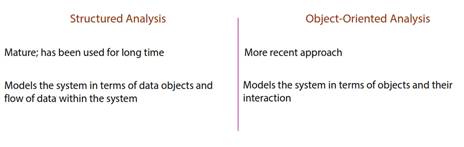
Figure 2 Comparison between Analysis methods
Each method looks at the system at different perspective.
Structured Analysis
Using Structured Analysis means creation of four models: data, functional, information-flow and
Behavioral.
Data model: Entity Relationship Diagram (ERD)
- Shows Data objects, their attributes, and relationships between these objects
Functional and Information-Flow models: Data Flow Diagram (DFD)
How data objects are transformed as they flow in the system
The functions that perform the transformation
Behavioral model: State Transition Diagram (STD)
- How system changes state in response to events
In the next points we will briefly examine each model and the methods to generate them.
Data Modeling ERD
The purpose of data modeling is to specify data objects consumed and produced by the system as well as the relationships between these objects.
A data object represents information that is understood by the system (e.g. “Customer” and “Ticket” are data objects of a Ticket Reservation system), and has attributes {properties} (e.g. “Age” and “Gender” attributes of “Customer” are consumed by the system && “TotalMiles” attribute of “Customer” is generated by the system). Data objects does not specify the operations! This is a primary distinction between Data Object and Object (used in Object-Oriented analysis). Lastly Data objects have relationships with other data objects (e.g. “Customer” purchases a “Ticket”).
Entity Relationship Diagram (ERD) is used to model data objects and their relationships. Figure 3 shows us the previous used example about the reservation system as a ERD, for creating this Vision has been used.
There are things that are good to know about ERD such as cardinality, however we will now present it in the current exposition.
Now that we have the data model, the next step is to see how the data flows in the system and how it changes during it’s flow.
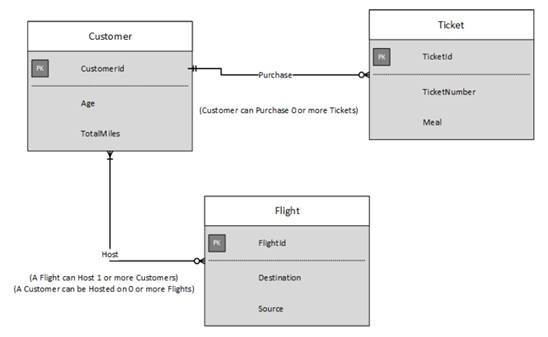
Figure 3 ERD for Reservation System
Information Flow and Functional Modeling
We first need to talk how to distinguish between Data and Information. In order to do that Figure 4 is introduced based on the Ticket Reservation example.
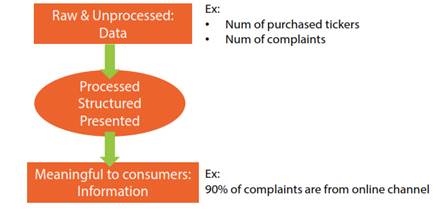
Figure 4 Data vs. Information
In general we can say that systems accept data from various sources __then__à data is processed and transformed __then__à Information is produced to customers, users, or other systems.
DFD serves two purposes:
- Shows how data objects flow through the system (Information-flow model)
- Shows transformation applied on these objects by various functions (Functional model)
A DFD is easy to understand since the notation consist of simple shapes. Figure 5 supplies some of the basic notation concepts and applies them to the Ticket Reservation example.
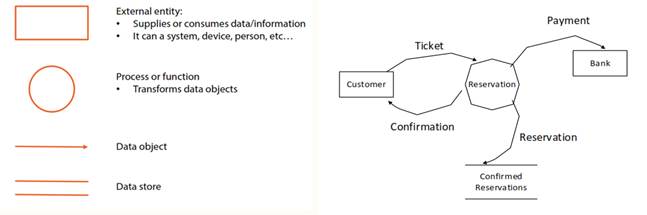
Figure 5 DFD Notations and Application
Now let’s talk about Process Specification or PSPEC. PSPEC describes a process in the final level of DFD. A DFD could have multiple levels, for example a Level-0 DFD would be only a system bubble – function (such as Reservation in our case), and it’s communication with external entities (such as Customer and Bank).
4.6 STD, CFD, and CSPEC or Behavioral Modeling
Behavioral models show how systems change state in response to events.
State Transition Diagram (STD) models system’s behavior by showing:
- the System states
- State changes in response to events
- Action to be taken as result of a specific event
In order to fully understand what System states are let’s consider the Ticket Reservation system
Customers can initiate a reservation process and continue it later
A Notification sub-system monitors the number of seats left
Notification sub-system changes its state to: plenty, running out, or filled
è Plenty, running out, and filled are states that indicate system behavior
A State Transition Diagram (STD) moves how the system moves from one of these states to the other. Labels up part indicates “events that cause State change” bottom part “System response in change”.
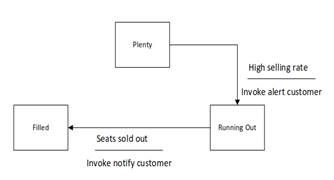
Figure 6 STD for Reservation system
One thing that we need to highlight here is that STD existed before UML, however, UML has adapted its own variation of STDs. It calls it Statechart, also called State Machine Diagram or State Diagram.
è STD used in Structured Analysis has different notation than UML State Diagram
Control Flow Diagram (CFD) shows control flow instead of data flow (DFD)
CFDs show how events (not data) flow in/out processes
Events entering causes activation/deactivation of processes
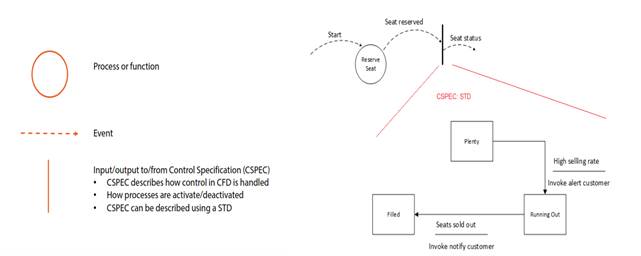
Figure 7 CFD Notation and Example
Structured Analysis Algorithm in Requirements Analysis phase.
- Define data objects and attributes based on Requirements Elicitation information
- Analyze with stakeholders relationships between data objects
- Create ERDs
3. Model functional and information-flow using DFDs
4. Model control instead of data using CFDs and CSPECs
5. STDs detail CSPECs
6. Pass models to design team -> Start developing
7. Pass models to testing team -> Start deriving Acceptance test
Why did we discussed Structured Analysis? Well making you a Structured Analysis expert was not the intention. The ideas was to show you the importance of modeling.
Can you see now how models:
Help analysts and stakeholders in system understanding and collaboration?
Guide the work of implementation team?